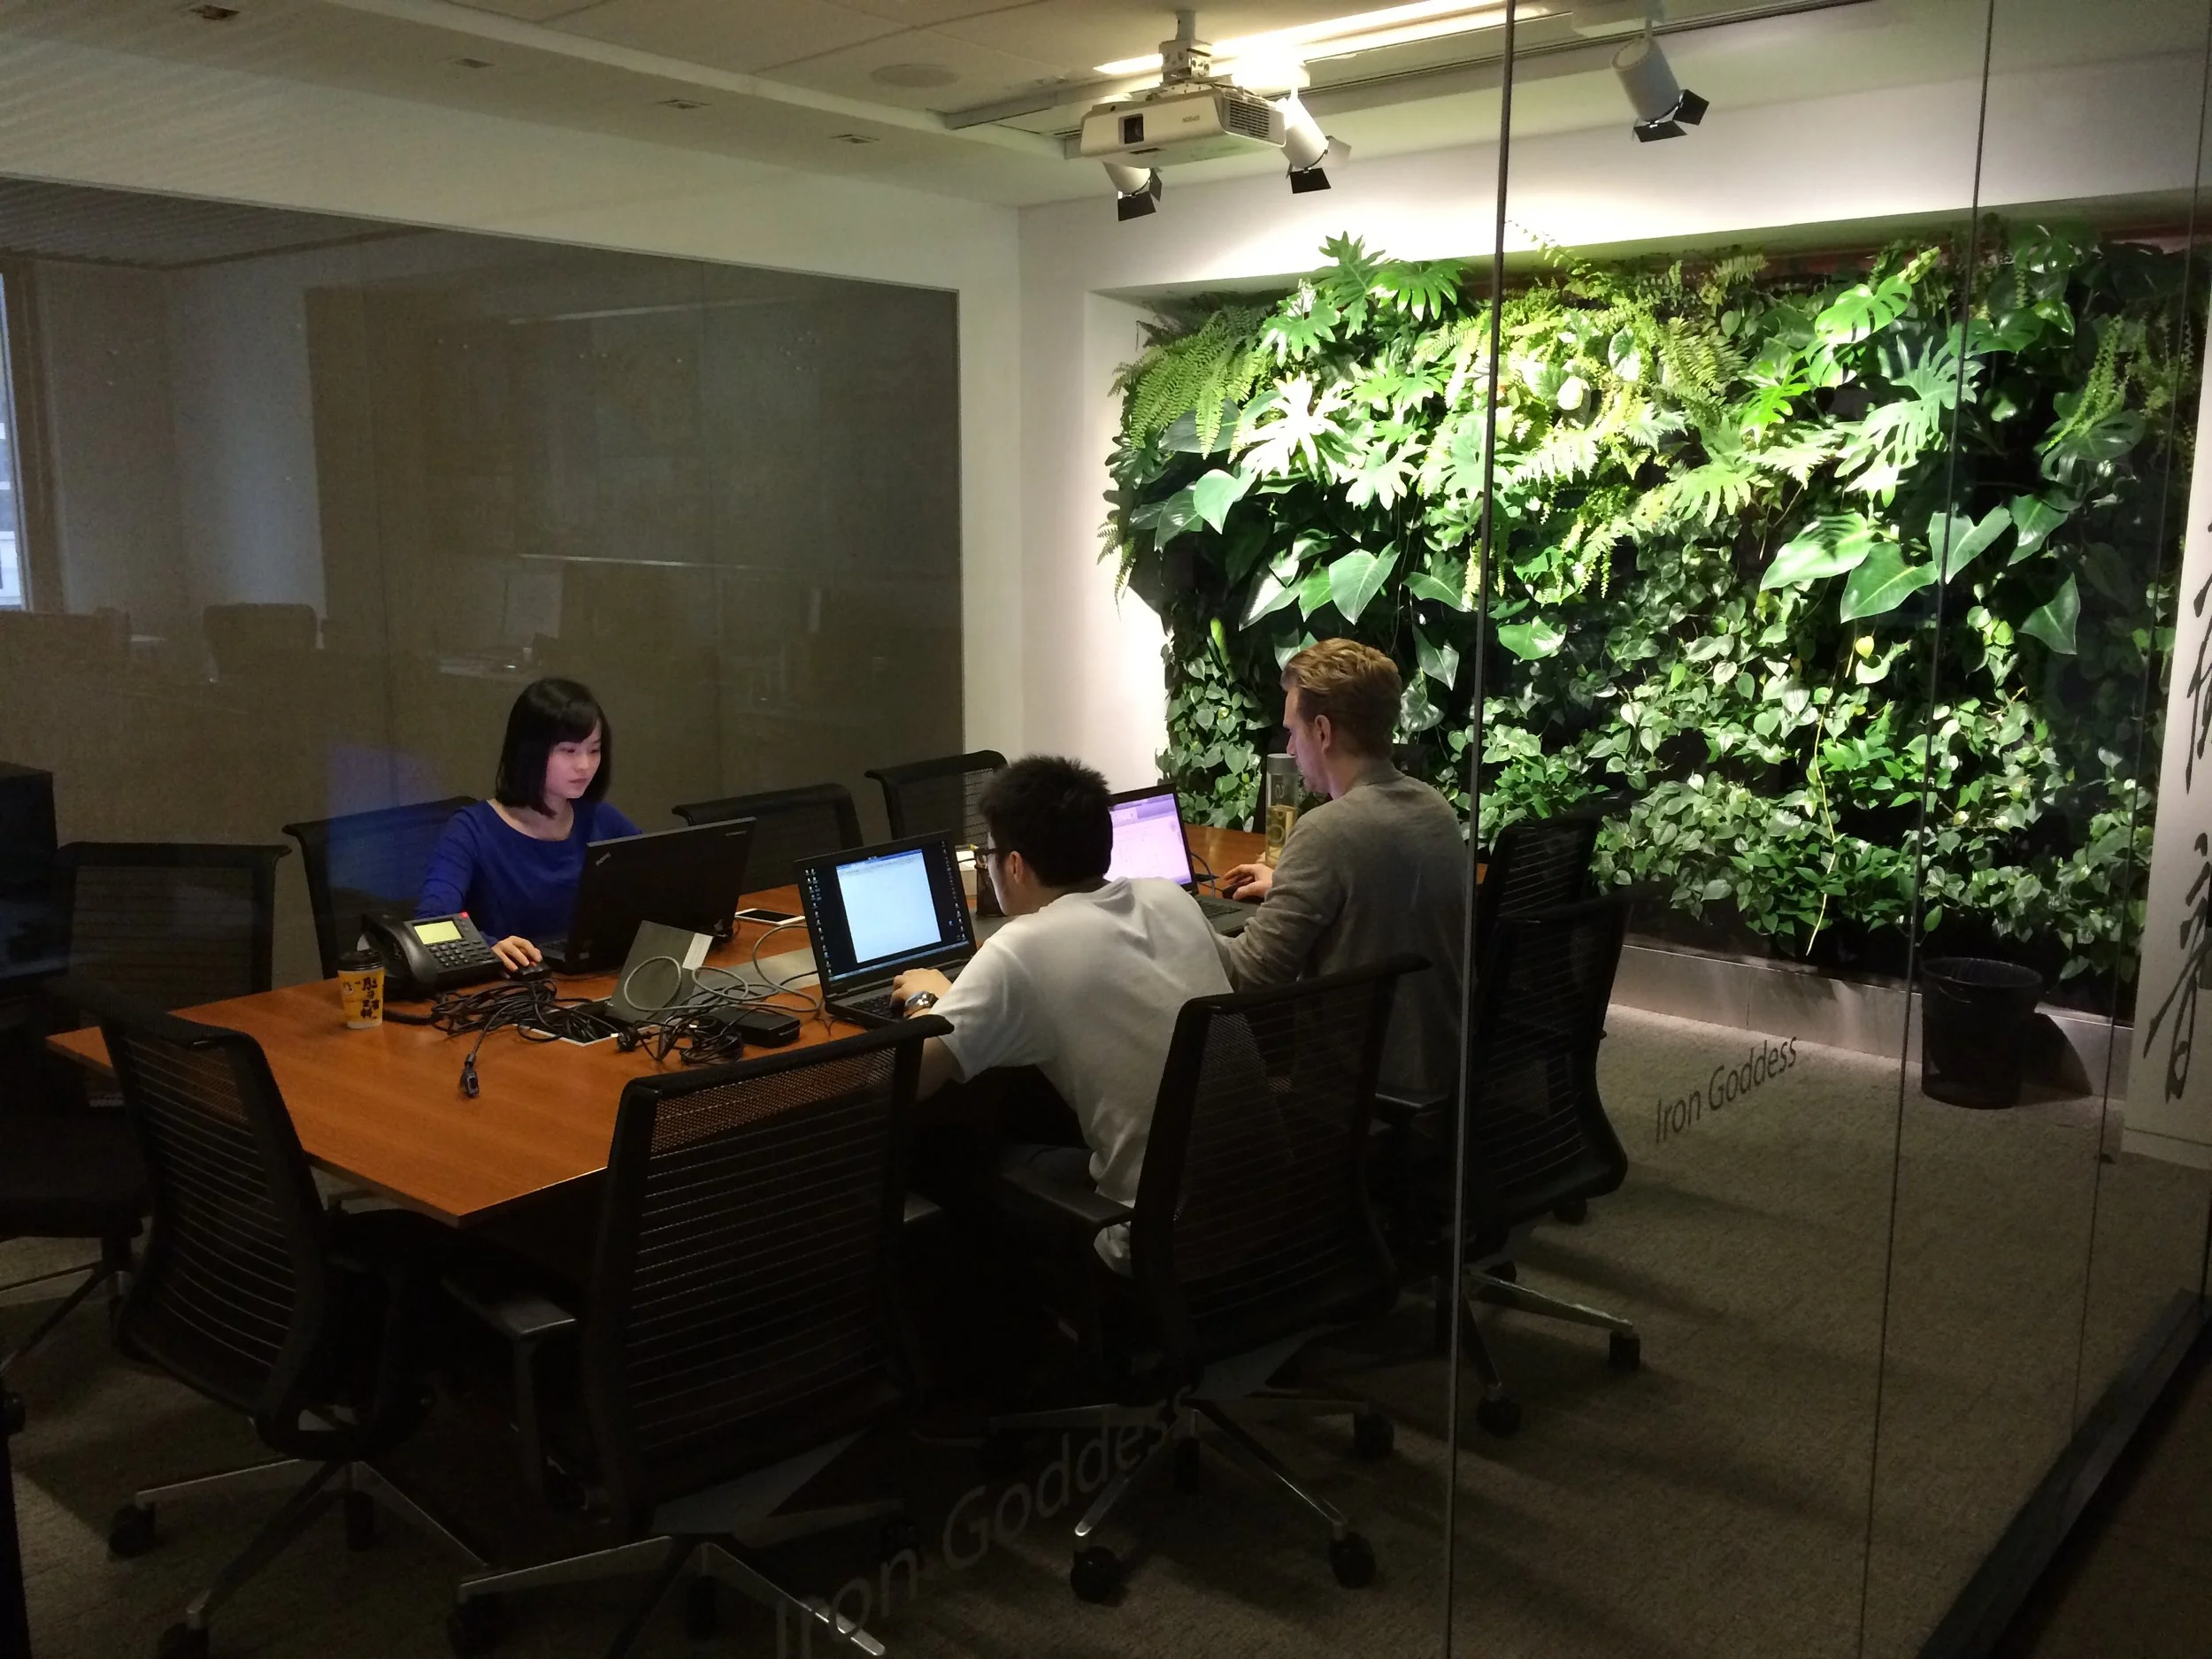
Ecological Scrubber

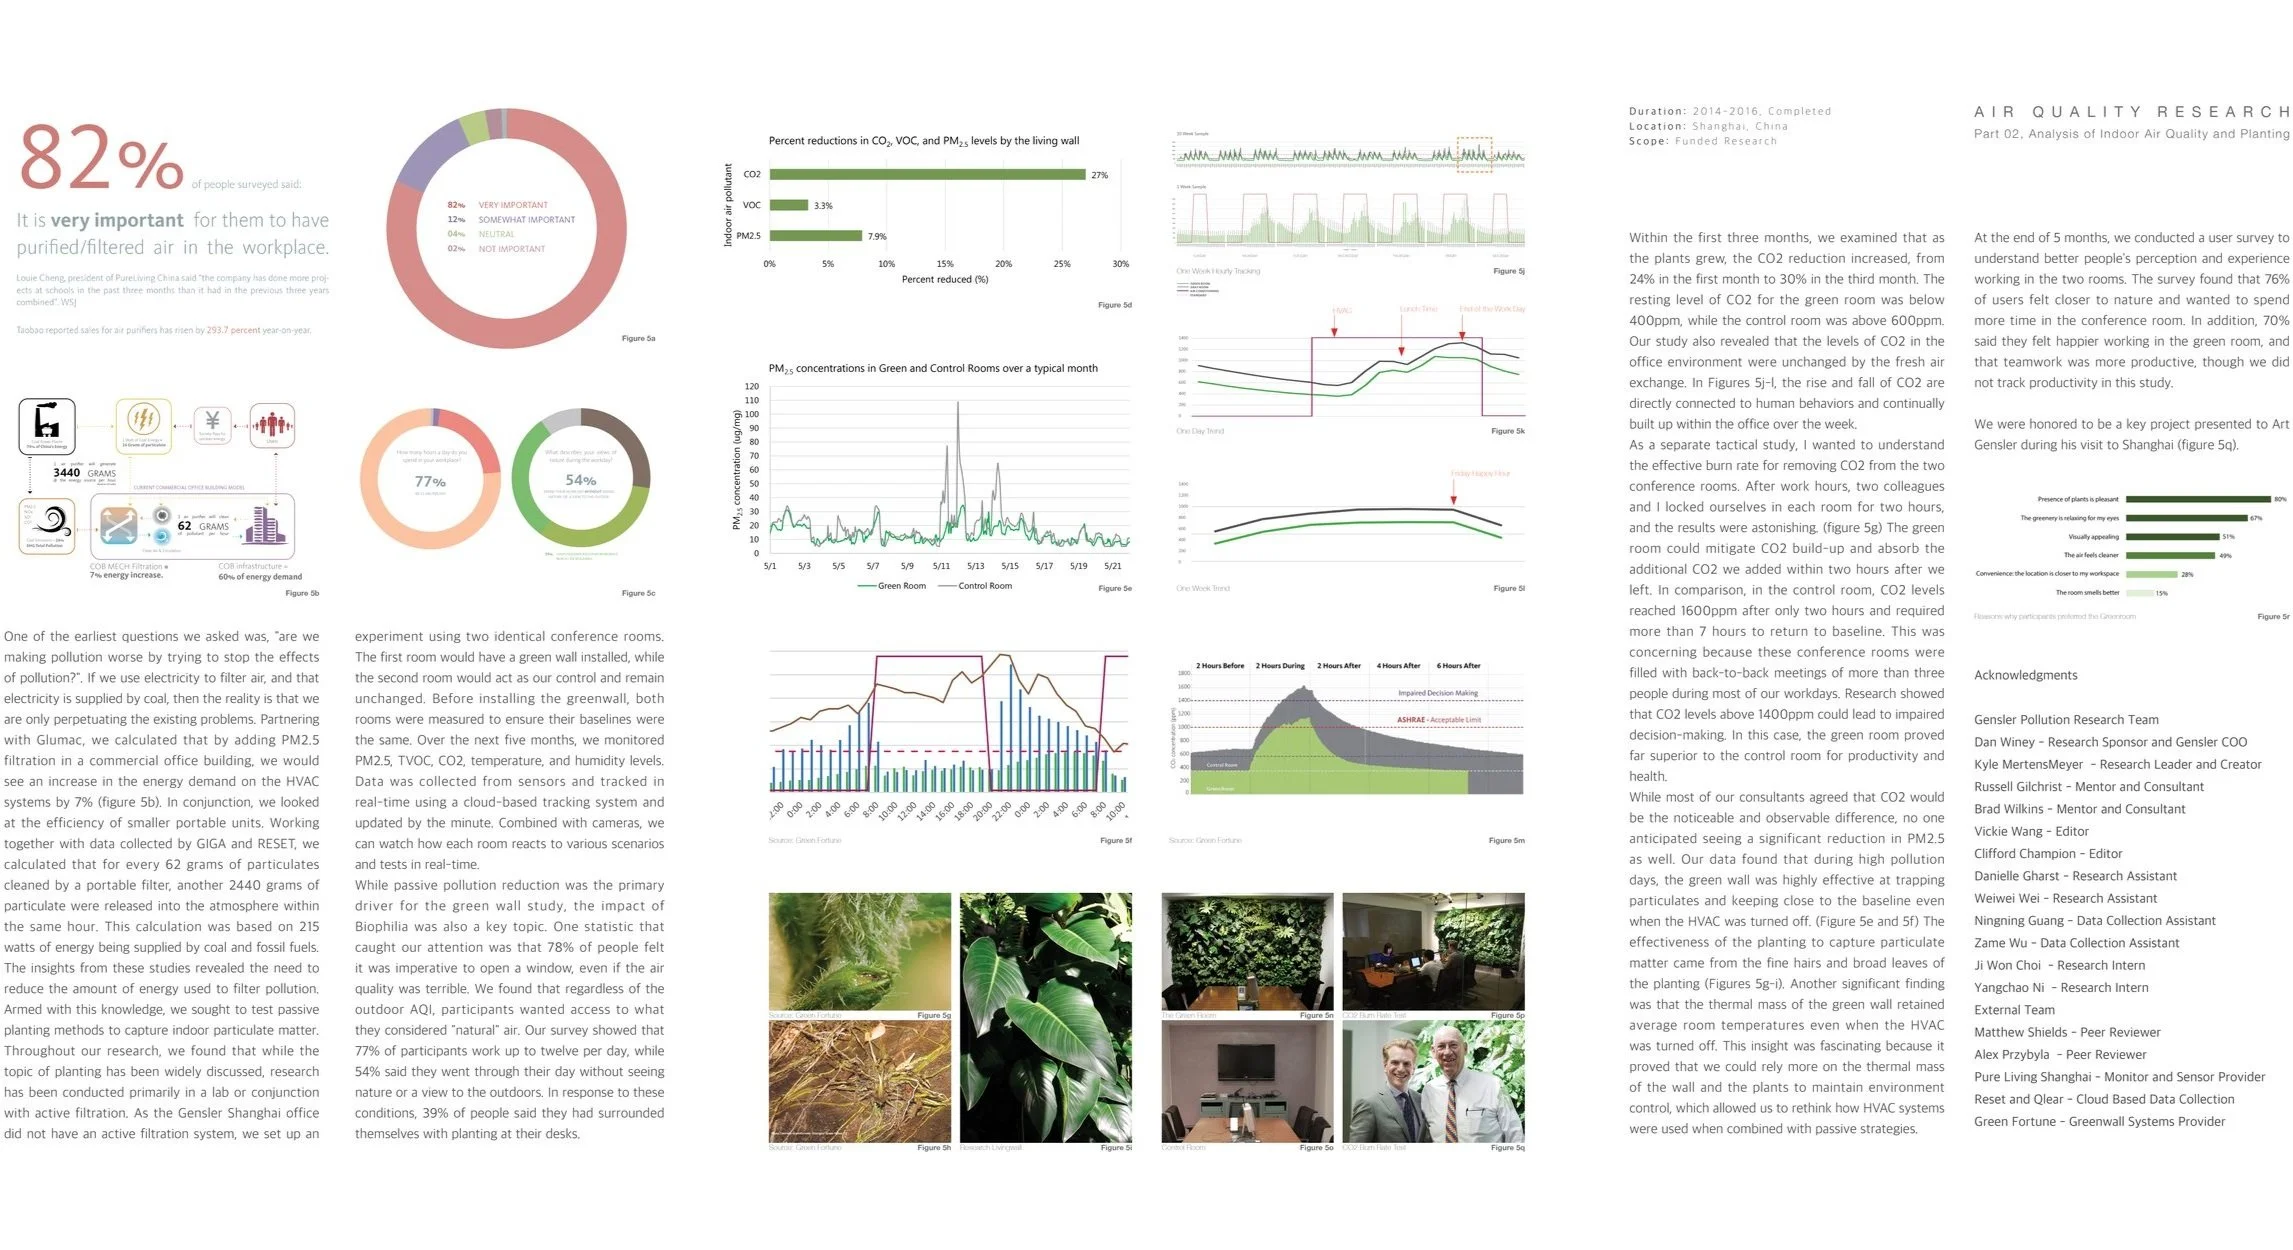
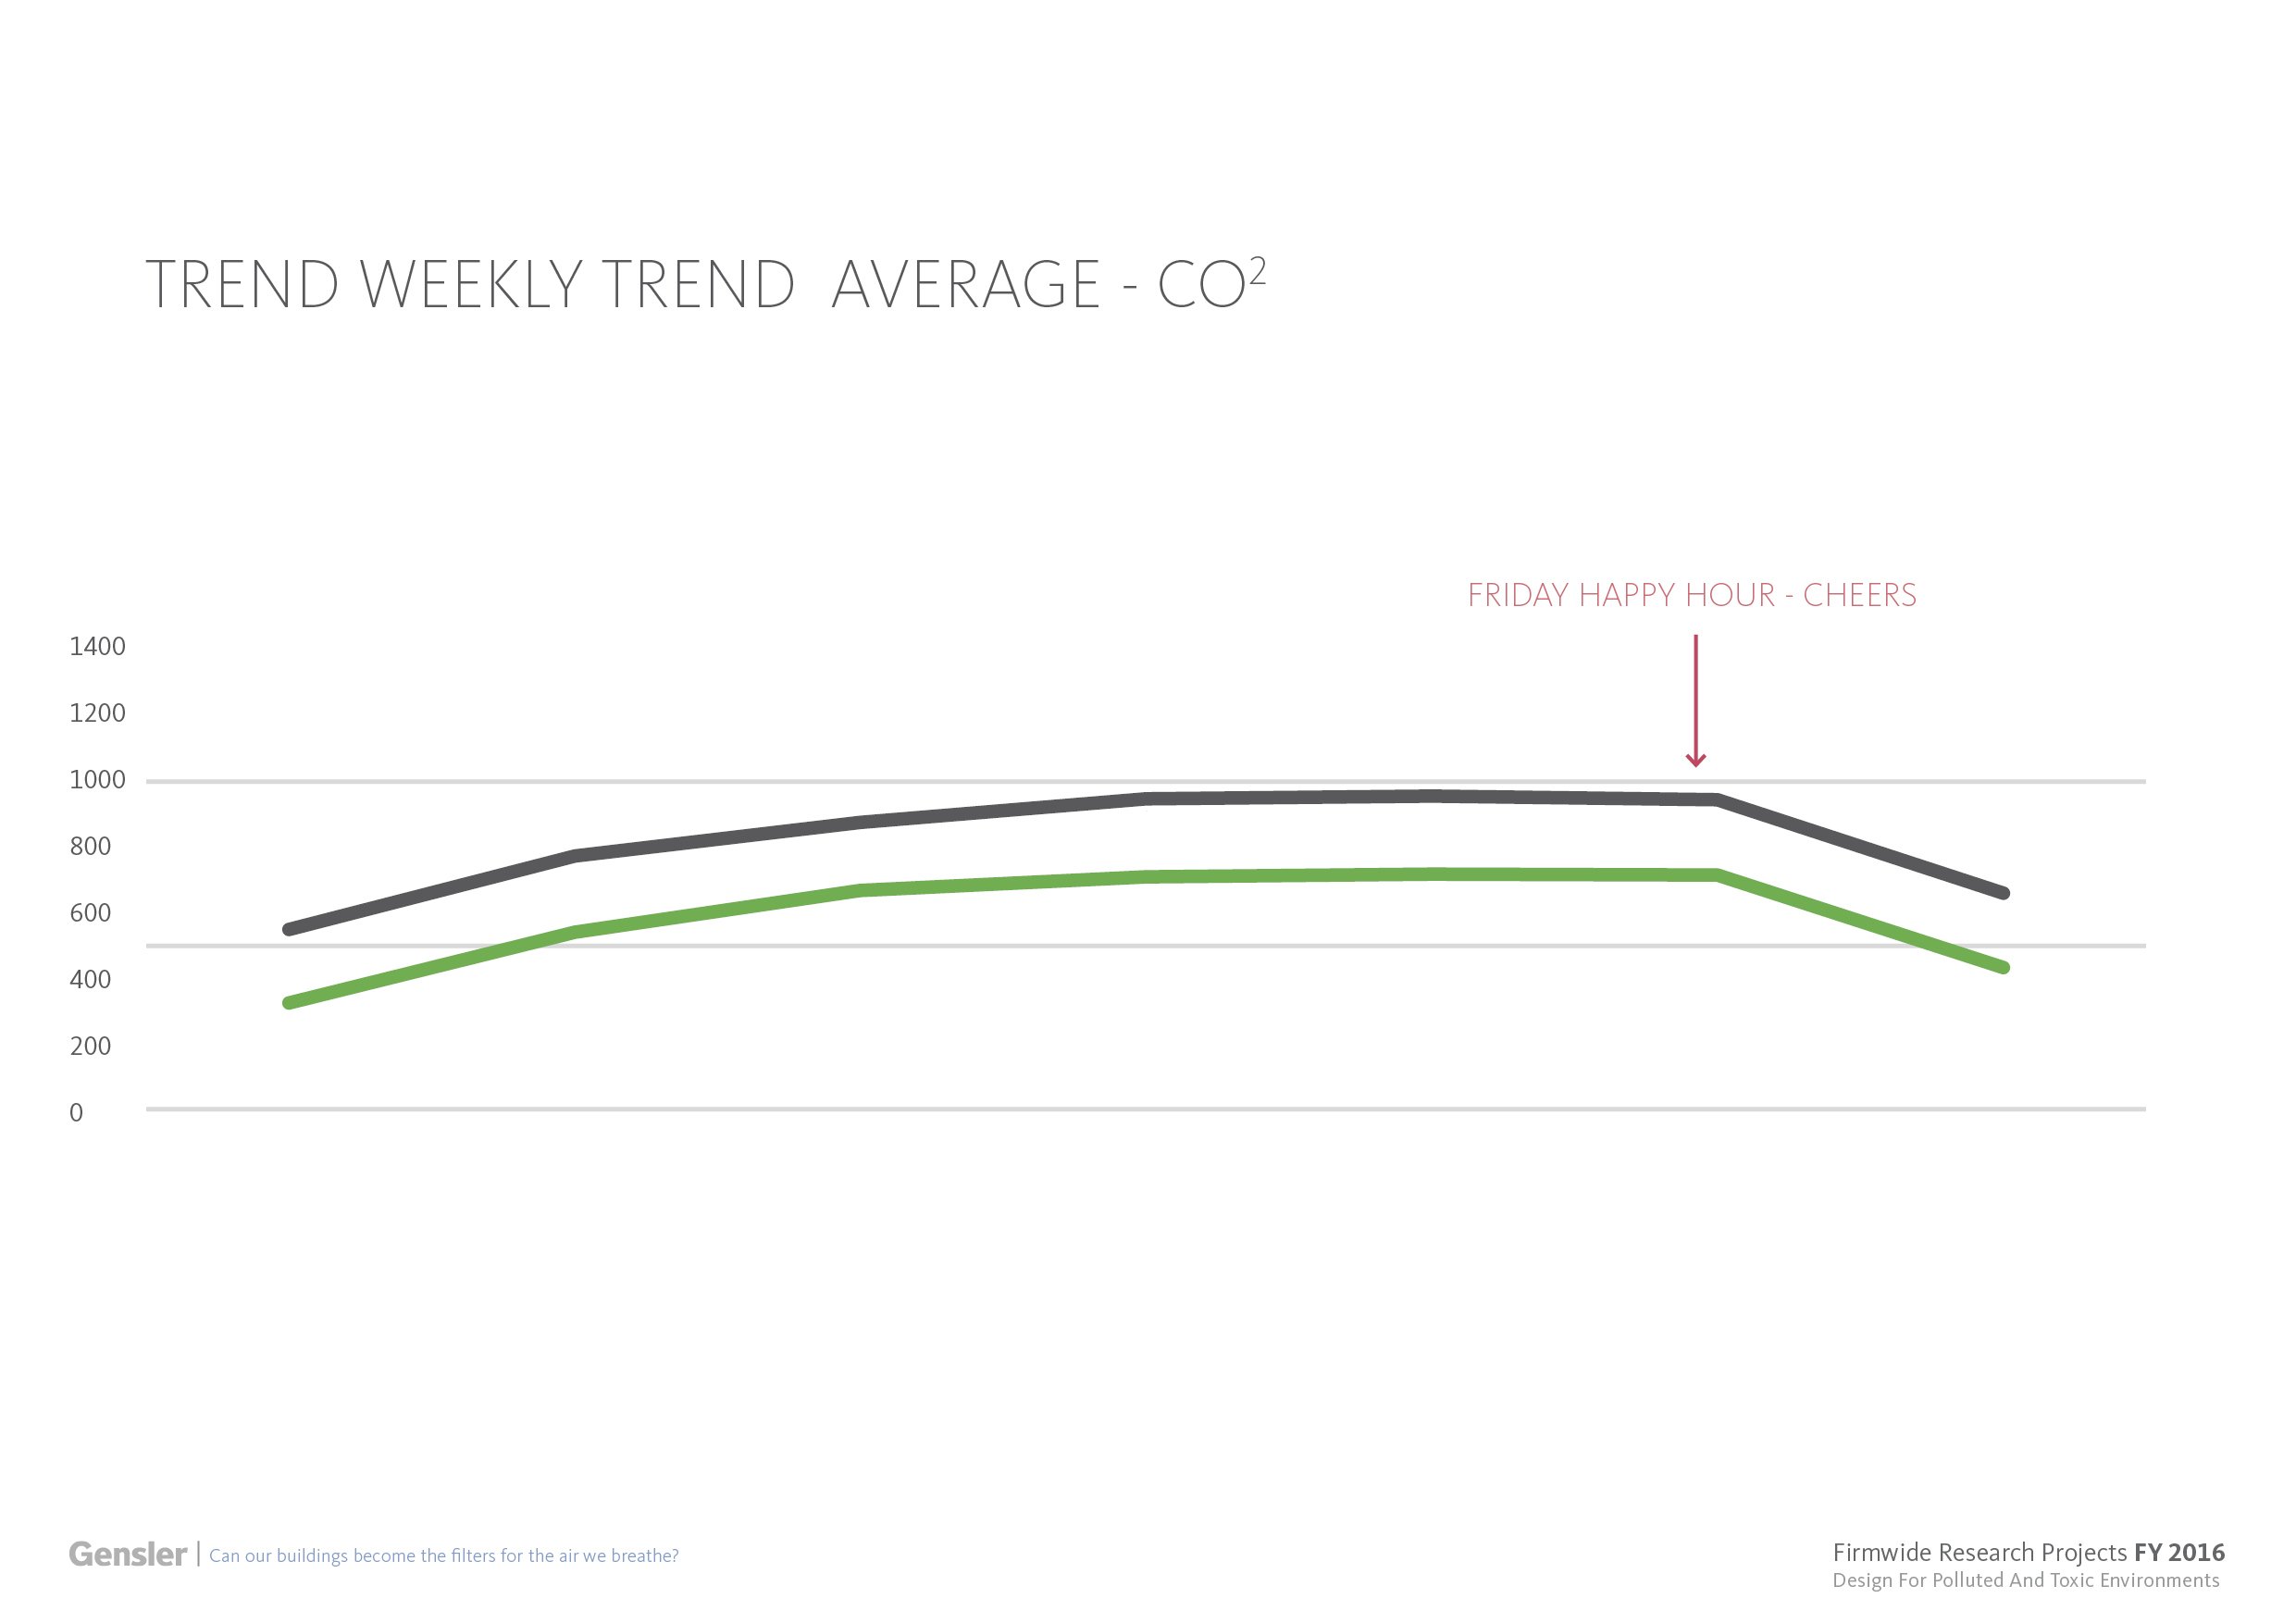
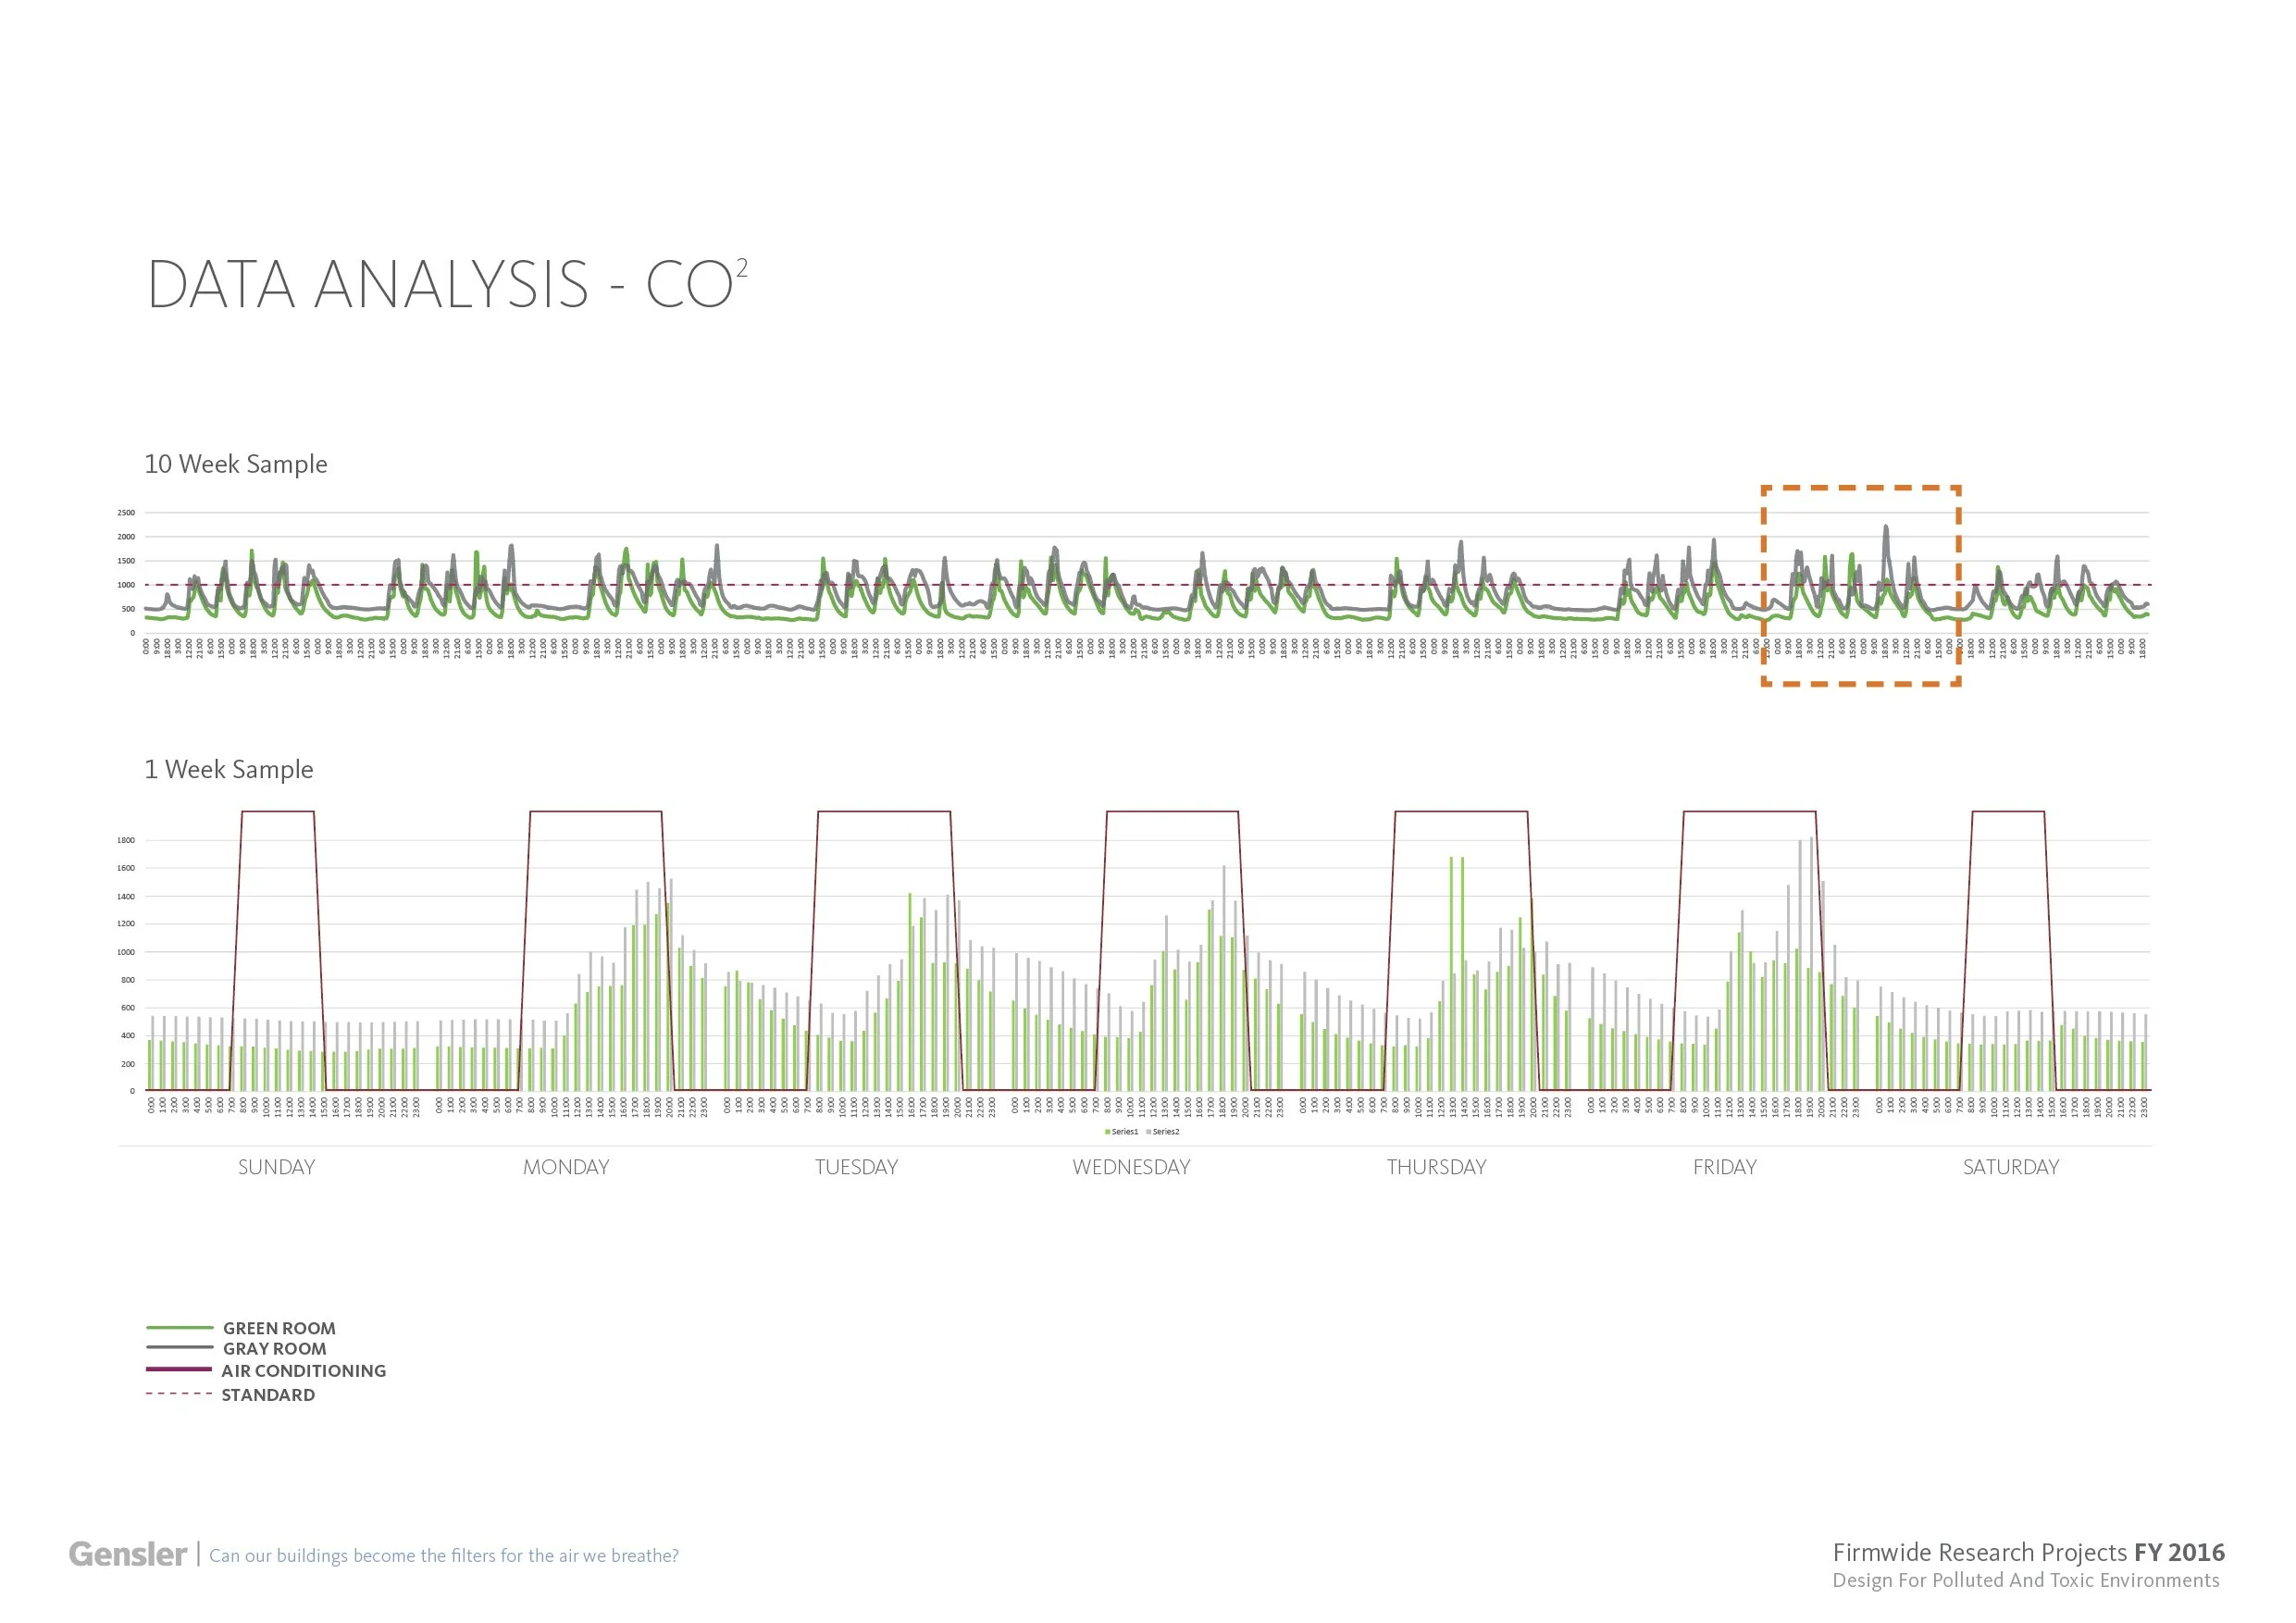
Over the course of five months, the research team tracked a controlled study between two actively used conference rooms. These two rooms were identical and tested for baseline flow rates. The only divination from the baseline was installing a living wall in one of the conference rooms. After tracking the PM2.5, CO2, TVOC, Humidity, and temperature, the results were groundbreaking and drew the interest of major developer Tishman Speyer.

An infographic report on indoor air quality research in Shanghai, China, including charts on pollution reduction, PM2.5 concentrations, and graphs of air quality data over time, alongside photographs of indoor plants, conference rooms, and group photos from the research team.
Two pie charts with statistics about nature viewing during work and indoor plants in the workspace. The left chart shows 77% of people spend 8-12 hours in the workplace daily. The right chart indicates 54% of people spend their workday without seeing nature or a view outside, while 39% have indoor plants they see regularly.
Two photographs, one of lush green plants and ferns in a forest or indoor garden, and another showing roots and underground network of a plant. The image is part of a research project about rhizosphere and metabolizes VOCs.
Close-up of glossy green leaves and a spiky green bud of a Pogostemon cablin plant, part of the trichomes. The image is part of a presentation about trichomes that attract dust, including PM.
Close-up of various green tropical and indoor plants with glossy, large leaves.
Screenshot of a news article about air pollution in Shanghai, showing a hazy city skyline, and a line graph with data on pollution levels over time.
Line graph showing hourly data trend averages for workday CO2 levels, with black and green lines indicating different data sets, over a 24-hour period, and highlighted sections for specific time ranges.
Line graph showing weekly trend averages of CO2 levels with three lines in shades of green and gray. The gray line peaks around Friday at 'Friday Happy Hour - Cheers' and then declines.
Line graphs comparing CO2 levels in green room, gray room, and air conditioning over 10 weeks and 1 week, with labels and a legend.
Three people working at a conference room table with laptops, with a green wall of plants behind them.